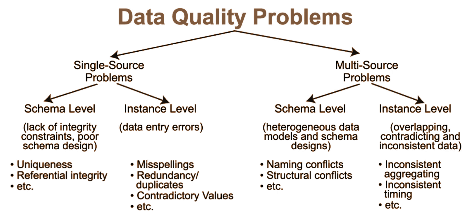
Identifying data quality issues is a critical step in the data preparation process, which can impact the outcomes of data-driven initiatives and machine learning models.
i. Here are several common data quality issues and ways to identify them:
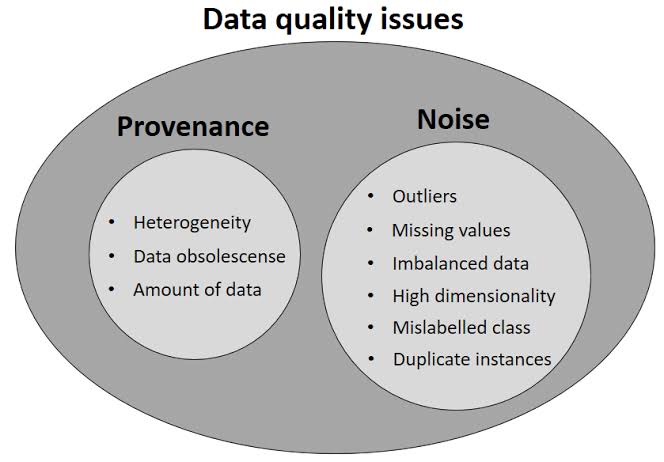
A. Missing Values: One of the simplest things to check is if data is missing from your dataset. These missing values can distort analytical results and lead to false conclusions. Libraries like Pandas in Python can help identify missing values.
B. Duplicate Data: Duplicate entries might inflate the data and distort the actual representation of the information. Duplicate entries can be easily caught by using pre-built functions in data processing tools, or by writing some simple code.
C. Inconsistent Data: There may occur inconsistencies especially with categorical data i.e. ‘Female’ represented as ‘F’, ‘female’, ‘Female’ etc. Text data typically requires some cleaning or transformation to ensure consistency.
D. Outliers: Outlier detection can be performed using statistical methods like Z-Score or IQR, visualizations like Box-Plots, or more advanced machine-learning methods.
E. Incorrect data types: Each attribute in a dataset has a specific datatype but sometimes you find discrepancies in them. For instance, numeric values stored as text can create hidden issues.
F. Inaccurate Data: These issues often stem from data entry errors, incorrect units of measure, rounding errors, etc.
G. Violations of Business Rules: Business rules are specific to your use case and dataset, but are an important part of data quality checking.
H. Legacy Data Issues: If data comes from a historical or legacy system, it may reflect outdated processes or contain errors that have propagated over time.
I. Temporal Data Issues: If date and time data isn’t handled correctly this can create lots of errors, especially when merging data from different time zones.
ii. Here are some common strategies to identify data quality issues:
A. Data Profiling:
o Start by examining the dataset’s structure, statistics, and patterns to uncover potential issues. This includes:
o Analyzing data types and formats
o Identifying missing values
o Detecting outliers and anomalies
o Examining value distributions
o Checking for inconsistencies in naming conventions or units of measurement
B. Descriptive Statistics: Compute statistics like mean, median, mode, min, max, quartiles, etc., to understand the distribution of your data. Outliers and unexpected variation often indicate quality issues.
C. Data Validation:
o Apply rules and constraints to verify data accuracy and consistency. This involves:
o Checking for invalid values (e.g., negative ages, text in numeric fields)
o Ensuring adherence to data type specifications
o Validating values against known ranges or acceptable formats (e.g., phone numbers, email addresses)

D. Visualization: Use plots and charts like histograms, box plots, scatter plots, and heatmaps to visually inspect the data. These can reveal outliers, distribution issues, and unexpected patterns that may indicate data quality problems.
E. Check for Completeness:
o Look for missing values and gaps in data. Use counts or visualizations to locate missing data.
o Investigate if missing values are random or systematic. Systematic missingness can indicate a problem in data collection or extraction processes.
F. Validate Consistency:
o Check for inconsistencies in data, like date formats, textual data with unexpected characters, or numerical data outside feasible range.
o Ensure categorical data has consistent labels without unintentional duplications (e.g., ‘USA’ versus ‘U.S.A’ or ‘United States’).
G. Data Accuracy Checks:
o Assess the accuracy of data values compared to real-world entities or events. This might involve:
o Comparing data with external sources or ground truth information
o Identifying errors in data entry or collection
o Using statistical methods to detect outliers or unlikely values
H. Cross-Field Validation:
o Check relationships between different fields or variables to ensure they align logically. For example, verify that start dates precede end dates.
o Look for discrepancies or anomalies when comparing related fields.
I. Temporal Consistency Checks:
o Ensure data timestamps and time-related information are consistent and valid. This includes:
o Checking for logical ordering of events
o Identifying missing or incorrect timestamps
o Detecting anomalies in time-series data
J. Check for Duplicates:
o Search for and remove duplicate records to avoid skewed analysis.
o Analyze if the duplicates are true duplicates or legitimate repetitions.
K. Validate Accuracy:
o Cross-reference your dataset with a trusted source to check the accuracy of records.
o Perform spot checks or sample audits, especially for critical fields.
L. Assess Conformity:
o Verify that the data conforms to specified formats, standards, or schema definitions.
o Check adherence to data types, lengths, and format constraints (e.g., zip codes should be in a specific format).
M. Look for Timeliness:
o Assess if the data is up-to-date and relevant.
o Outdated data can lead to incorrect or irrelevant insights.
N. Evaluate Reliability:
o Consider the sources of your data and whether they are reliable.
o If data is collected from multiple sources, ensure that the information is consistent across them.
O. Identify Integrity Issues:
o Analyze data relationships and dependencies to ensure referential integrity.
o Check for orphans in relational data, foreign key mismatches, etc.
P. Look for Integrity Issues in Data Transformation:
o Verify that data transformation processes (ETL: Extract, Transform, Load) did not introduce errors.
o Checking transformation logic for potential errors or misinterpretations can help maintain the quality of the data.
Q. Machine Learning Models:
o Use machine learning models for anomaly detection to automatically identify patterns that deviate from the norm.
o Train models to predict values and compare predictions to actual values to uncover inconsistencies.
R. Contextual Analysis:
o Leverage understanding of language and real-world concepts to identify issues that might not be apparent through statistical analysis alone. This includes:
o Detecting inconsistencies in text data (e.g., misspellings, contradictory statements)
o Identifying implausible values based on context (e.g., negative sales figures)
o Understanding relationships between different data fields to uncover inconsistencies
S. Feedback Incorporation:
o Learn from feedback provided by users or domain experts to refine data quality assessment capabilities. This includes:
o Identifying patterns of errors that might not be easily detectable through automated methods
o Incorporating domain knowledge to improve data validation rules and constraints
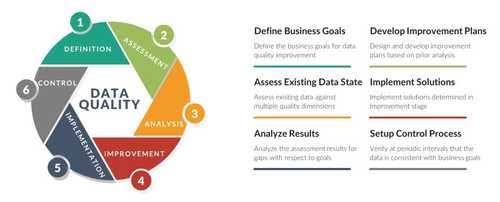
T. Data Quality Frameworks:
o Adopt established data quality frameworks or standards, such as DAMA (Data Management Association) or ISO 8000, to guide assessments and improvements.
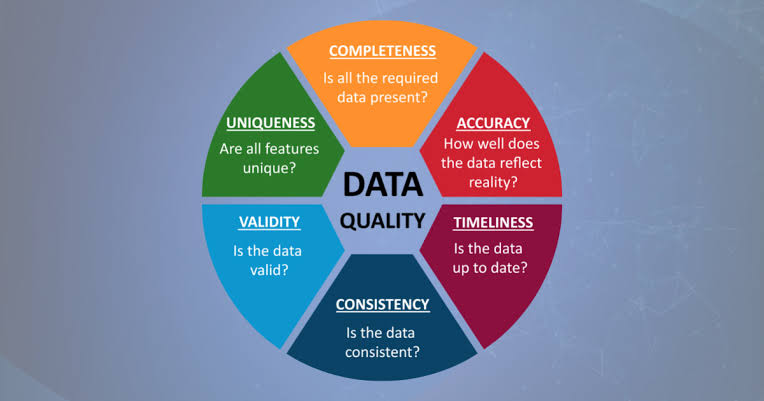
U. Data Quality Metrics:
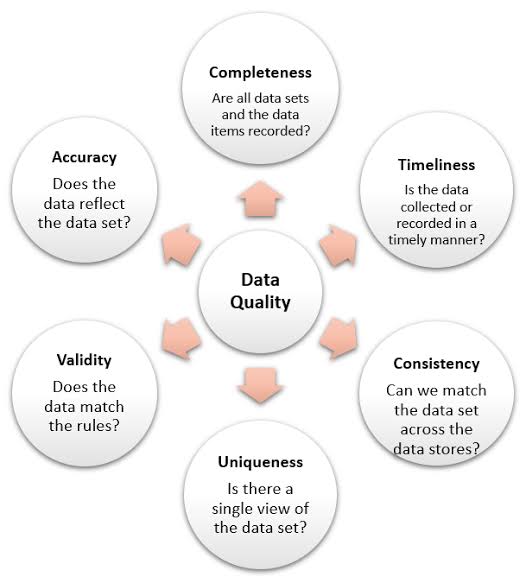
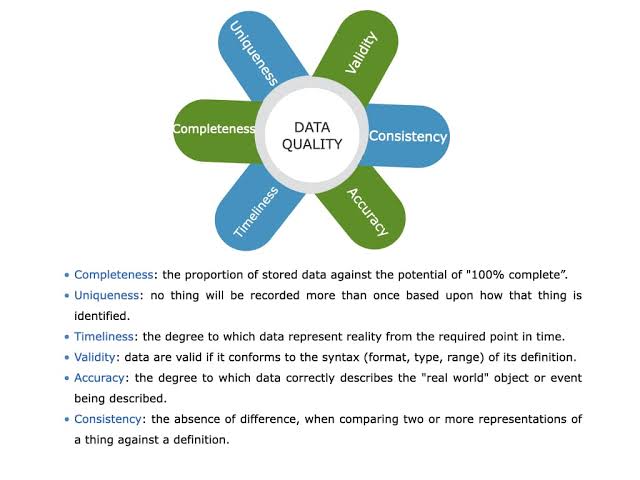
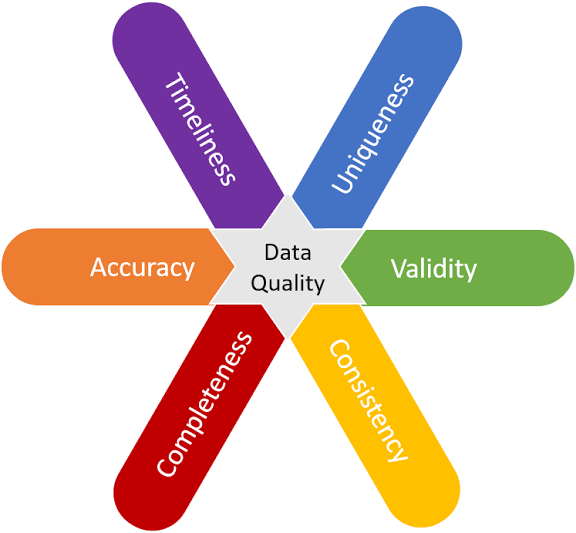
o Define and calculate data quality metrics, including completeness, accuracy, consistency, timeliness, and reliability, to quantitatively assess the overall quality of the dataset.
V. Continuous Monitoring:
o Continuously monitor data quality over time to detect new issues or changes in data patterns. This helps in proactively addressing data quality problems and maintaining data integrity.
Software tools, scripting languages (like Python and R), data quality frameworks, and manual checks can all be employed to perform these tasks.
The choice of strategy depends on the size and complexity of the dataset, as well as the criticality of the dataset for the task it is intended for.
Regularly performing these checks as part of a comprehensive data quality assurance process will help maintain the integrity and reliability of your dataset.
https://www.collibra.com/us/en/blog/the-7-most-common-data-quality-issues
https://www.kdnuggets.com/2022/11/10-common-data-quality-issues-fix.html