In a world recovering from the pandemic aftermath, Ukrainian and Middle Eastern wars, risks in one sector of business can set off a chain reaction of effects across the entire supply chain, similar to falling dominos.
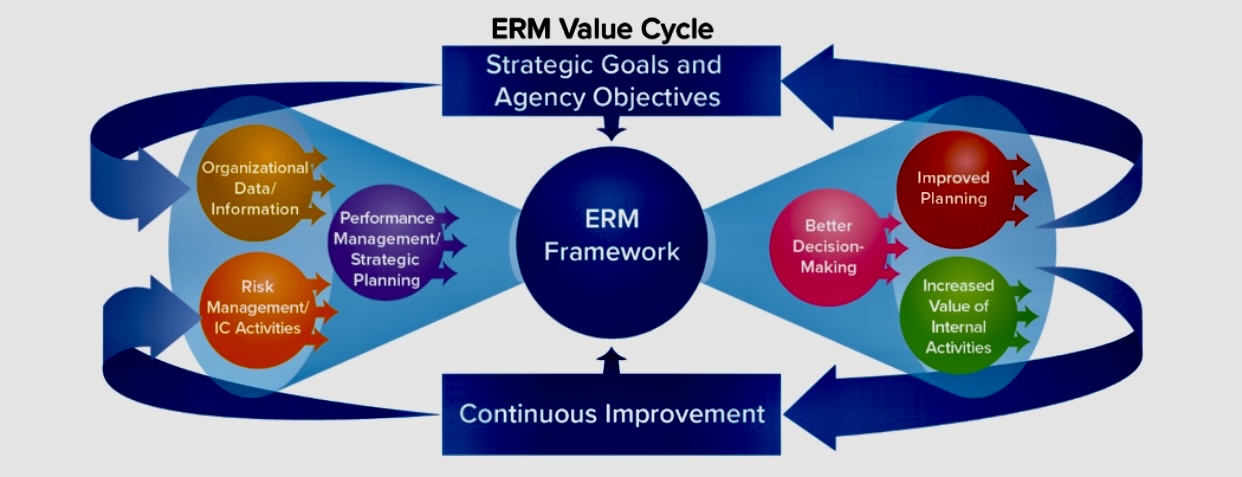
This highlights that the focus of enterprise risk management (ERM) in today’s business environment is not solely about preventing negative incidents; but also about transforming potential risks into business opportunities.
The key to this transformation lies in effective ERM reporting.
ERM enables organizations to identify possible event occurrences, but it’s through ERM reporting that they can assess their risk management strategies to discover what’s effective, what’s failing, and how to address any potential gaps in risk management.
Efficient ERM reporting can help organizations leverage their risks into a competitive edge. Therefore, it’s crucial for businesses to understand what’s required to generate a high-quality ERM risk report.
What Is an ERM Report?
An ERM report provides crucial information for daily decision-making by assisting board members in recognizing the risks their organizations confront. Furthermore, it describes the risk management approaches implemented to address these risks.
High-quality ERM reports highlight gaps in the execution or coverage of risk management methods and potential non-compliance scenarios. While this is critical from a strategic point of view, it also has a legal aspect. Boards have legal obligations to comprehend and manage the organization’s risks effectively.
Some key audiences for risk reporting
Risk reporting serves various key audiences within an organization. Here are some key audiences for risk reporting:
A. Board of Directors and Executive Management: The board of directors and executive management team play a crucial role in governing and overseeing the organization. They need comprehensive risk reports to understand the organization’s overall risk landscape, make informed decisions, and fulfill their fiduciary responsibilities.
B. Risk Management Committee: In organizations that have a specific risk management committee, risk reporting is vital. This committee is responsible for reviewing and monitoring the organization’s risk management activities, and risk reports provide them with the necessary information to assess and steer risk management efforts.
C. Senior Management: Senior management includes executives and the CEO, all needing more detail than the board. A risk report for senior management often involves reporting up; they want a list of risks and accompanying mediation plans from their ERM staff. This helps senior management ensure that the proper management strategies are in place for the risks in the report, which can feature as many as 15 possible issues.
D. Risk Owners: Risk owners are the ERM staff on the front line, including middle managers. These individuals act on the mitigation recommendations from senior management and the board. Reports for risk owners require a high level of detail on each risk, including performance metrics and assessments.
E. Operational and Business Unit Managers: Operational and business unit managers are directly responsible for managing specific areas of the organization. Risk reports tailored to their respective areas provide them with visibility into the risks affecting their operations, enabling them to make risk-informed decisions and take appropriate mitigating actions.
F. Compliance and Legal Teams: Risk reporting is essential for compliance and legal teams to ensure that the organization operates within the boundaries of laws, regulations, and industry standards. They rely on risk reports to identify compliance gaps and potential legal risks.
G. Regulators: Regulatory agencies are the primary external audience for risk reports. ERM reporting for regulators requires a careful balance; they must help the regulator understand the risks and assure that the organization meets regulatory requirements without providing so much detail that it will attract further review.
H. Internal and External Auditors: Internal and external auditors need risk reports to understand the organization’s risk profile and assess the effectiveness of internal controls and risk management processes. Risk reports help them prioritize audit activities and identify areas requiring further scrutiny.
I. Investors and Shareholders: Investors and shareholders are interested in understanding the organization’s risk exposures and management strategies. Risk reporting creates transparency and reassures them that risk-related matters are identified, monitored, and appropriately managed.
J. Employees: While not the primary audience, employees benefit from risk reporting as it provides insights into the organization’s risk culture, potential impacts on their roles, and actions being taken to address risks. It helps foster awareness and accountability throughout the organization.
Each audience may have specific requirements and preferences, so producing tailored risk reports for these stakeholders strengthens risk communication and fosters a risk-aware culture.
Good Practices of an ERM Report
Creating an ERM report that adheres to best practices ensures its effectiveness and usefulness. Here are some key best practices to consider when developing an ERM reporting framework:
A. Clear and Concise Format: Present information in a clear, concise, and logical manner. Use headings, subheadings, and bullet points to enhance readability and facilitate easy navigation within the report.
B. Alignment with Objectives: Ensure that the ERM report directly aligns with the organization’s objectives and risk appetite. The content should focus on the most important risks that can impact the achievement of these objectives.
C. Set Measurable Objectives: The report should be tailored to the organization’s objectives. What are the risks that might prevent the organization from achieving those objectives? This is the basis for a good ERM report.
D. Comprehensive Risk Coverage: Provide a comprehensive overview of risks, including both internal and external risks. Consider strategic, operational, financial, compliance, and emerging risks to present a holistic view of the organization’s risk landscape.
E. Quantitative and Qualitative Analysis: Combine quantitative data (e.g., risk events, financial impacts) with qualitative analysis (e.g., risk descriptions, likelihood, and impact assessments). This approach provides a balanced perspective on risks and their potential effects.
F. Risk Interdependencies: Highlight interconnections between different risks, demonstrating how a risk in one area can impact other parts of the organization. This understanding helps identify systemic risks and potential cascading effects.
G. Actionable Insights: Provide actionable insights to drive risk management activities. Include risk response strategies, control assessments, and recommendations for risk mitigation or avoidance.
H. Historical Trends and Future Forecasts: Discuss historical trends and patterns to identify areas of concern or improvement. Also, provide forecasts or scenarios to help stakeholders anticipate future risks and plan accordingly.
I. Regular Update Frequency: Develop a schedule for regular reporting updates that suits the organization’s needs and risk dynamics. Ensure that stakeholders receive timely and up-to-date information to support decision-making.
J. Clearly Define the Report: Establish a report structure that defines everything from the recipients to the names of input fields and the calculations required to evaluate each risk. Defining the structure of the report should always come before design.
K. Continuously Evaluate Report Structures: Risks are constantly evolving, so the report should, too. Organizations should always consider whether they must include more risks in the report or additional fields to deliver the correct information about each risk’s management.
L. Create a Consistent ERM Language: The board of directors may understand and communicate risk differently than the rest of the ERM team. Ensure employees use the same ERM language to reduce miscommunication surrounding the report.
M. Use Visual Aids: Incorporate visual elements such as charts, graphs, and visuals to support data interpretation and enhance understanding. Visual representations can communicate complex information more effectively.
N. Ensure Data Is Reliable: For ERM reporting to create a competitive edge, the data must be high quality. Validate all risk sources to ensure reporting is based on high-quality, reliable information. Organizations that integrate ERM enterprise-wide are more likely to have access to trustworthy data.
O. Outline Key Takeaways: Reports can be long, but senior management and the board of directors don’t always have time to read every page. Highlight critical takeaways so they can easily find and review the action items that matter most.
P. Deliver Reports On Time: Whether organizations deliver reports once a month or once a year, the report should always be on-time according to that timetable. ERM teams should also prepare the information immediately before they deliver it since a report that’s six months old will no longer be helpful to the board.
Q. Show Trends Over Time: Presenting trends over time can provide stakeholders with a better understanding of whether the organization’s risk profile is improving or deteriorating.
R. Make Reports Actionable: Good ERM reports should empower senior management and the board to take action. Recommended actions and strategies should accompany each risk, giving the board the information they need to move forward.
S. Facilitate Effective Decision-Making: All ERM reports should do one thing: allow the board to make better decisions. These reports should clarify the organization’s potential risks and make it easy for the CEO and the board to take revenue-saving and even revenue-driving action.
T. Continuous Improvement: Regularly seek feedback from report recipients and stakeholders to improve the clarity, relevance, and value of the ERM report. Adapt and refine the reporting framework based on the evolving needs of the organization.
By employing these best practices, organizations can produce ERM reports that provide valuable insights, support informed decision-making, and drive effective risk management processes.
Benefits of effective ERM reporting:
A. Improved risk management: Effective ERM reporting helps organizations to improve their risk management by:
o Identifying and assessing risks more effectively
o Developing and implementing more effective risk management strategies
o Monitoring and improving the effectiveness of risk management activities
B. Increased stakeholder confidence: Effective ERM reporting helps to increase stakeholder confidence by:
o Demonstrating that the organization is taking steps to manage its risks
o Providing stakeholders with the information they need to make informed decisions
C. Reduced costs: Effective ERM reporting can help to reduce costs by:
o Identifying and mitigating risks before they cause damage
o Improving the efficiency of risk management activities.
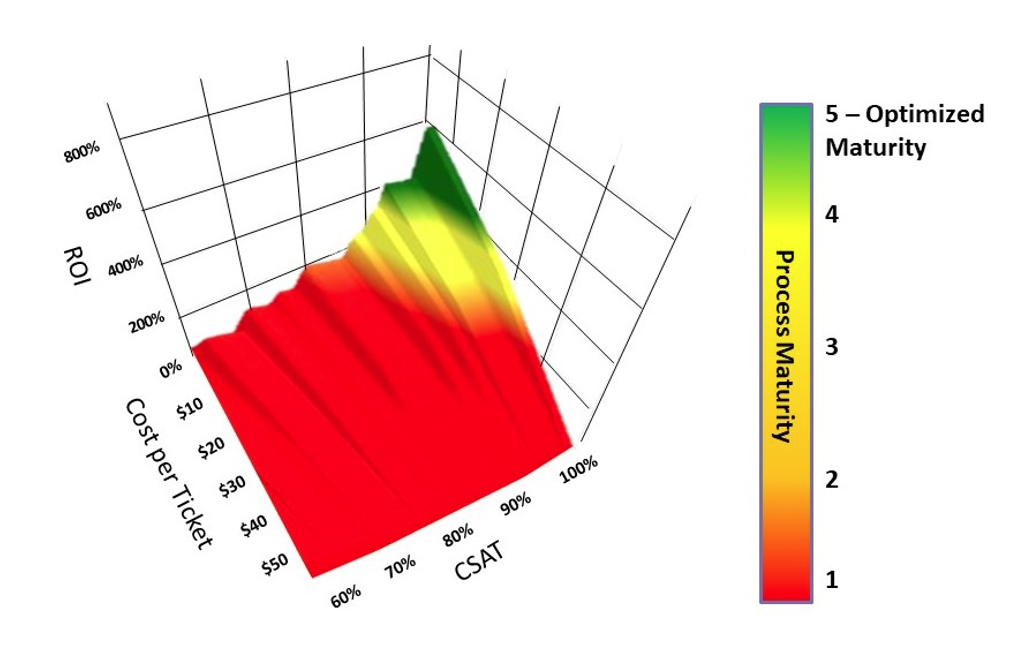
ERM Maturity
The landscape of risk today is constantly shifting, influenced by factors such as digitization, remote work, and the unstable nature of today’s economy.
To develop an ERM reporting system that bolsters organizational performance, organizations must initially focus on elevating their ERM maturity.
Though each step towards maturity calls for careful planning, the reward is the creation of an ERM framework that cannot just intercept risks before they affect the business, but also convert those risks into potential opportunities.
By adhering to these recommendations, organizations can build efficient ERM reports that effectively articulate both the potential risks encountered by the organization and the measures being implemented for their management.
https://erpminsights.com/qualities-of-a-good-enterprise-risk-management-report/